Open a sample report in Tribo-Lab ™ en “Buscar una muestra”. La parte superior del informe contiene toda la información que necesita para tomar medidas sobre los resultados.
This is a color-coded scale with a severity range of “0 to 4”, the severity of the report is displayed in a large box with a white number inside, surrounded by a color field. It should be noted that the overall severity of the report is based on observations, and not just the results of individual tests.
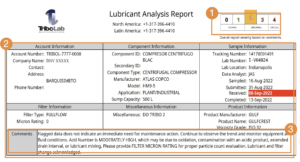
This area contains information about the account, component, sample, filter, product (fluid), and miscellaneous information. It is not necessary to fill in the miscellaneous information field when submitting the sample. Examples of miscellaneous information, this field can include the time the sample was taken or the initials of the person taking the sample.
This section includes the analysis of the test results, including maintenance recommendations and observations from our data analysis team. These comments, along with the results of individual analyze, determine the overall report severity and establish a preventive and / or corrective action plan for the tribological system.
This area provides information on “ppm” concentrations of the elemental metals in the sample through the ICP-OES (Inductively-Coupled Plasma – Optical Emission Spectrometry) ASTM D5185 test. Discharging concentrations of wear metals and additive metals from the evaluated fluid.
This area contains information about the sample to be considered by the data analyst (date sampled, date received, lubrication time, unit time, lubricant change, added lubricant, and filter change).
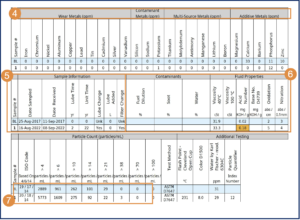
This area returns results for external contaminants such as water, fuels and sludge through the ASTM D-7686 test. FTIR and the unit in% mass / volume. Additional tests will be performed depending on the type of fluid and the test package requested.
The test results marked will have a colored background that is related to the severity of the scale at the top.
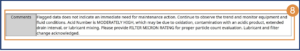
Comments from previous sample reports are included along with the severity of the overall report.
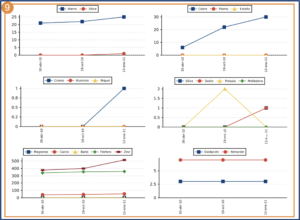
The graphs shown in the report can be selected by setting “Sample report display” in “My Settings” in your Tribo-Lab ™. account.